Who Came Up With the Startup Investing J Curve?
The concept of the Startup Investing J Curve is a widely recognized phenomenon in the venture capital and startup ecosystem, illustrating the typical financial trajectory of early-stage investments. This curve depicts an initial period of losses or slow growth, followed by a sharp upward trend as the startup matures and scales. While the J Curve has become a cornerstone of investment strategy, its origins are less commonly discussed. Understanding who conceptualized this model and how it evolved provides valuable insight into the principles of startup investing. This article explores the history and development of the J Curve, shedding light on its significance in shaping modern investment practices.
Who Came Up With the Startup Investing J Curve?
The Startup Investing J Curve is a concept widely recognized in the venture capital and startup ecosystem. It describes the typical pattern of financial performance in early-stage investments, where initial losses are followed by significant gains as the startup matures. The idea is often attributed to venture capitalists and investment theorists who observed this recurring pattern in high-growth startups. While no single individual is credited with inventing the term, it has become a cornerstone in understanding the lifecycle of startup investments.
See Also What Are Secondary Investments in Venture Capital What Are the Benefits
What Is the Startup Investing J Curve?
The J Curve represents the trajectory of a startup's financial performance over time. Initially, investments in a startup lead to negative returns due to high upfront costs, such as product development, marketing, and operational expenses. However, as the startup gains traction, achieves product-market fit, and scales, the value of the investment begins to rise sharply, forming the upward slope of the J. This pattern is particularly common in venture capital and private equity investments.
Why Is the J Curve Important in Startup Investing?
The J Curve is crucial because it helps investors understand the inherent risks and long-term potential of startup investments. Early-stage investors must be prepared for initial losses and have the patience to wait for the startup to reach its growth phase. This concept also underscores the importance of diversification in a startup portfolio, as not all investments will follow the J Curve successfully.
See Also Who is the Best Headhunter for the Venture Capital Start Up Space
Who Popularized the J Curve Concept?
While the exact origin of the J Curve concept is unclear, it has been widely popularized by venture capital firms and investment experts. Notable figures in the venture capital world, such as Fred Wilson of Union Square Ventures and Marc Andreessen of Andreessen Horowitz, have frequently discussed the J Curve in their writings and presentations. Their insights have helped solidify the concept as a fundamental principle in startup investing.
How Does the J Curve Apply to Different Stages of Startup Growth?
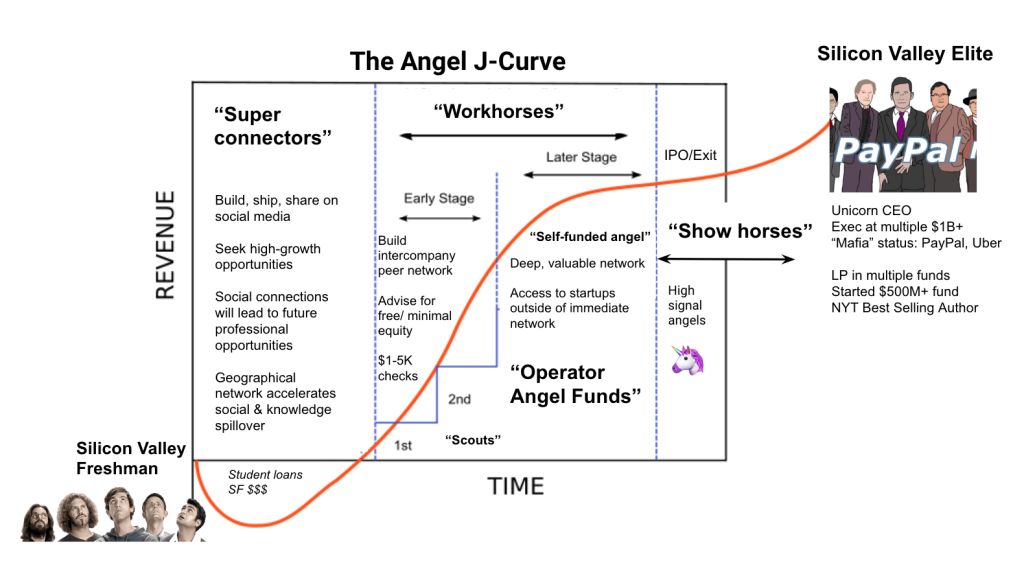
The J Curve applies differently depending on the stage of the startup. In the seed stage, the curve is steeply negative as the company burns through cash to build its product. During the Series A and B rounds, the curve begins to flatten as the startup achieves milestones like customer acquisition and revenue growth. By the later stages, the curve turns sharply upward, reflecting the startup's increased valuation and potential for an exit event, such as an IPO or acquisition.
See AlsoCan I Skip a Funding Round as a Founder in a Startup to Avoid Further DilutionWhat Are the Key Factors That Influence the J Curve?
Several factors influence the shape and success of the J Curve in startup investing. These include:
- Market Potential: The size and growth rate of the target market.
- Execution Capability: The startup's ability to deliver on its business plan.
- Funding Rounds: The amount and timing of capital raised.
- Exit Strategy: The likelihood of a successful exit, such as an IPO or acquisition.
| Factor | Impact on J Curve |
|---|---|
| Market Potential | Determines the ceiling for growth and valuation. |
| Execution Capability | Influences the startup's ability to scale and achieve milestones. |
| Funding Rounds | Affects the startup's runway and ability to reach key growth phases. |
| Exit Strategy | Shapes the potential return on investment for early backers. |
Who came up with the J-curve?

 Is Goldman Sachs or Venture Capital a Better Career Starter?
Who Introduced the Concept of the J-Curve?
The concept of the J-curve was introduced by economist James Meade in the mid-20th century. Meade used this concept to describe the phenomenon where a country's trade balance initially worsens after a currency devaluation before eventually improving. The J-curve illustrates the time lag between the devaluation and the subsequent adjustment in trade volumes and prices.
- James Meade was a British economist and Nobel laureate.
- He developed the concept to explain the effects of currency devaluation on trade balances.
- The J-curve is named for its shape, resembling the letter J, which depicts the initial decline followed by a recovery.
What Does the J-Curve Represent in Economics?
The J-curve represents the short-term and long-term effects of a currency devaluation on a nation's trade balance. Initially, the trade balance deteriorates because import prices rise faster than export volumes adjust. Over time, as export volumes increase and import volumes decrease, the trade balance improves.
See Also Who Are the Most Active Vcs in Dallas, Texas?
- The initial dip in the curve reflects higher import costs.
- The recovery phase shows increased export competitiveness.
- The curve highlights the time lag in economic adjustments.
How Did James Meade Develop the J-Curve Theory?
James Meade developed the J-curve theory while studying the relationship between exchange rates and trade balances. He observed that immediate price effects of devaluation often overshadowed the slower volume adjustments, leading to the characteristic J shape.
- Meade analyzed historical data on currency devaluations.
- He identified the time lag between price changes and trade adjustments.
- The theory was later supported by empirical studies in international economics.
What Are the Key Factors Influencing the J-Curve Effect?
Several factors influence the J-curve effect, including the elasticity of demand for exports and imports, the speed of adjustment in trade volumes, and the degree of currency devaluation. These factors determine the depth and duration of the initial decline and subsequent recovery.
- Elasticity of demand determines how quickly trade volumes adjust.
- The magnitude of devaluation affects the initial price shock.
- Economic policies can either mitigate or exacerbate the effect.
How Is the J-Curve Applied in Modern Economics?
In modern economics, the J-curve is applied to analyze the impact of exchange rate fluctuations on trade balances and economic policies. It is also used to predict the effects of currency devaluations or appreciations in global markets.
- Economists use the curve to assess trade policy effectiveness.
- It helps in understanding the short-term vs. long-term impacts of currency changes.
- The concept is applied in international trade negotiations and economic forecasting.
What is the J-curve for startups?
What is the J-Curve in the Context of Startups?
The J-curve is a graphical representation of a startup's financial performance over time, typically showing an initial decline followed by a significant upward trend. In the early stages, startups often experience losses due to high initial costs, such as product development, marketing, and hiring. However, as the business gains traction, revenues begin to grow exponentially, creating the upward slope of the J.
- Initial Investment Phase: Startups incur heavy expenses before generating revenue.
- Revenue Growth: After overcoming initial challenges, the startup begins to scale and increase profits.
- Break-even Point: The point where revenues finally exceed costs, marking the start of profitability.
Why Do Startups Experience the J-Curve?
Startups experience the J-curve because they require significant upfront investment to build their product, establish a customer base, and scale operations. During this period, cash burn rates are high, and revenues are minimal or nonexistent. However, once the startup achieves product-market fit and operational efficiency, the curve begins to rise sharply.
- High Initial Costs: Product development, marketing, and infrastructure setup.
- Delayed Revenue: Time is needed to attract and retain customers.
- Scaling Challenges: Overcoming operational inefficiencies before achieving growth.
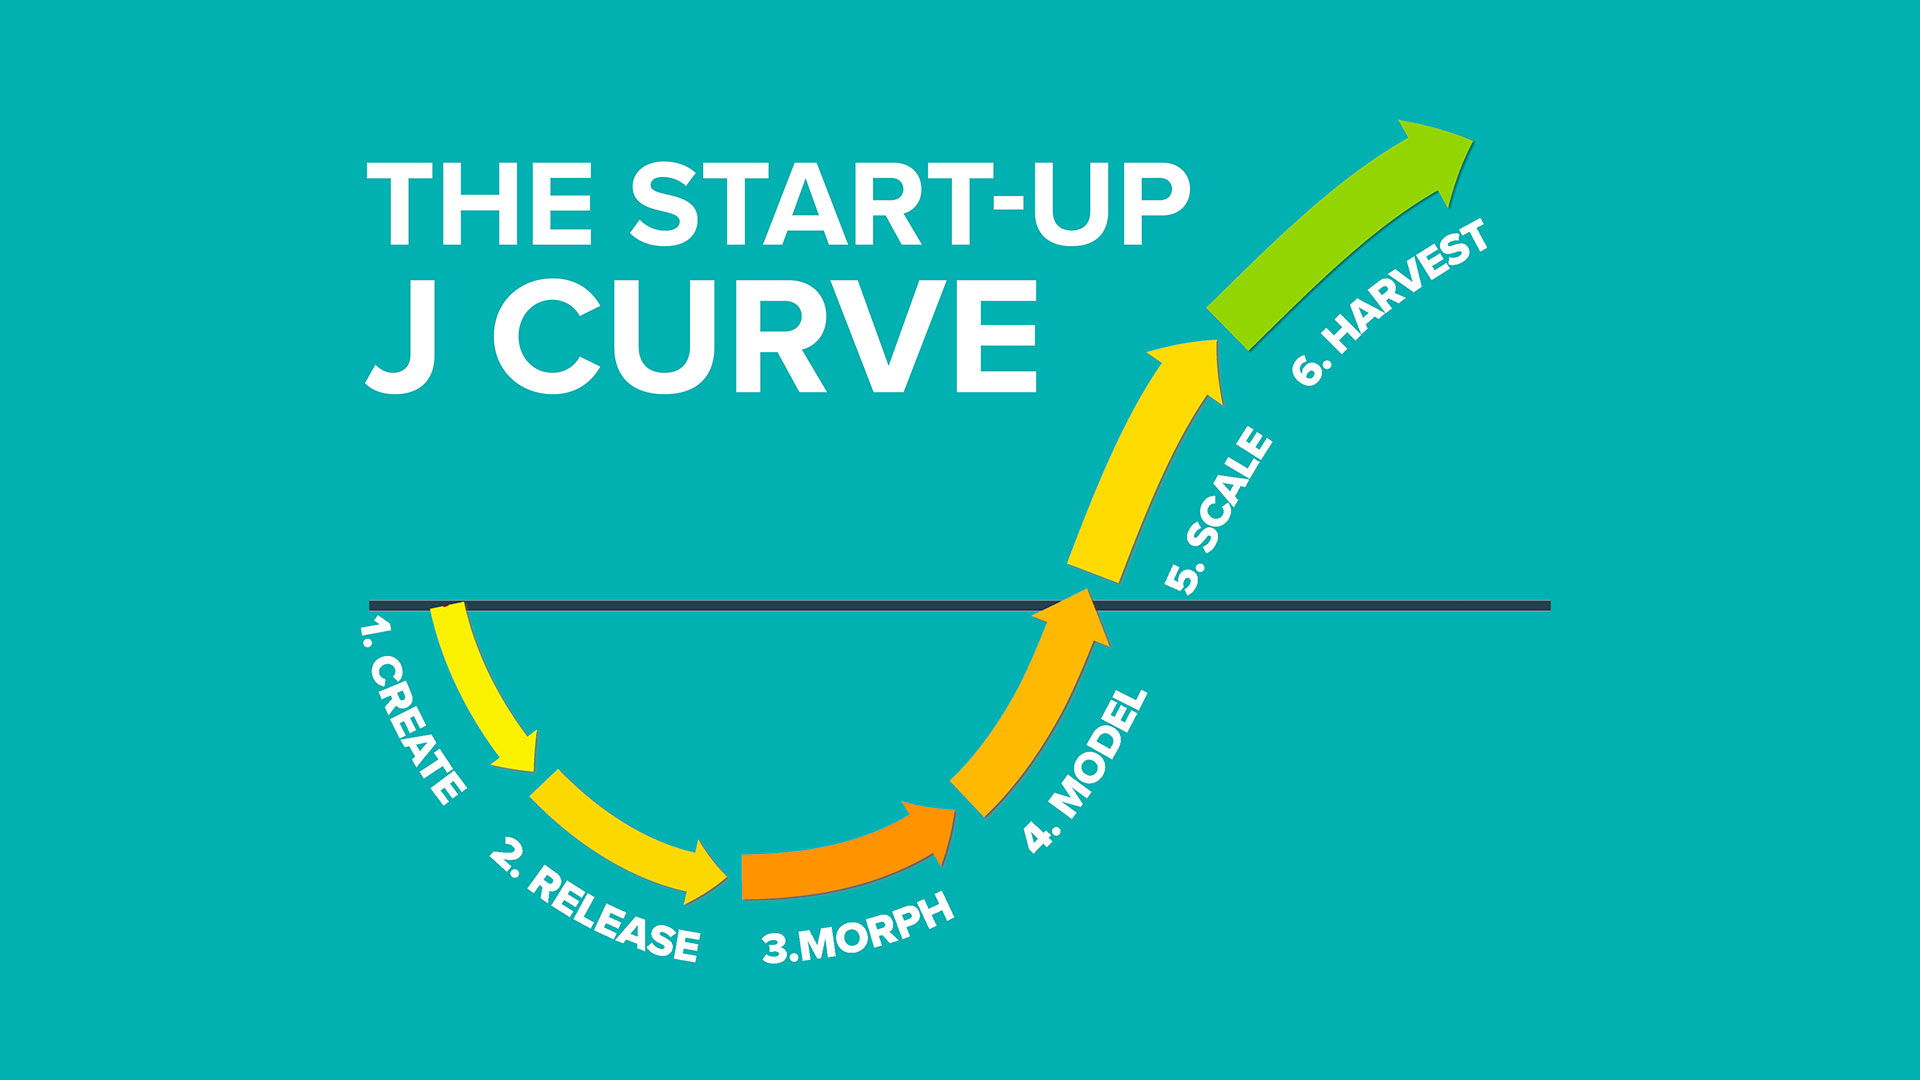
Key Stages of the J-Curve for Startups
The J-curve can be divided into distinct stages that reflect the startup's journey from inception to profitability. These stages include the initial investment phase, the trough of losses, and the eventual upward trajectory as the business scales.
- Investment Phase: Capital is spent on product development and market entry.
- Trough Phase: The period of maximum losses before growth begins.
- Growth Phase: Revenues start to rise as the startup gains market share.
Navigating the J-curve requires careful planning, disciplined spending, and strategic decision-making. Startups must focus on achieving milestones that drive growth while managing cash flow to survive the initial downturn.
- Efficient Cash Management: Prioritize spending on critical activities.
- Milestone-Based Funding: Raise capital in stages tied to specific goals.
- Customer Acquisition: Focus on strategies that deliver quick revenue growth.
Common Mistakes Startups Make During the J-Curve
Many startups fail to navigate the J-curve effectively due to common pitfalls such as overspending, poor planning, and underestimating the time required to achieve profitability. Avoiding these mistakes is crucial for long-term success.
- Overspending: Allocating resources to non-essential activities.
- Lack of Planning: Failing to anticipate cash flow challenges.
- Impatience: Expecting quick results without allowing time for growth.
What is J-curve investment?

What is J-Curve Investment?
The J-curve investment refers to the graphical representation of the performance of an investment, typically in private equity or venture capital, over time. Initially, the investment shows a decline in value due to upfront costs, fees, and operational expenses. However, as the investment matures and begins to generate returns, the curve starts to rise, resembling the shape of the letter J. This pattern highlights the initial dip followed by a significant upward trajectory.
Why Does the J-Curve Occur?
The J-curve occurs due to several factors that impact the early stages of an investment. These include:
- Initial Costs: High upfront expenses such as management fees, due diligence, and setup costs.
- Operational Expenses: Costs associated with restructuring or scaling the business.
- Time Lag: The delay between making the investment and realizing returns as the business grows.
Key Characteristics of the J-Curve
The J-curve is characterized by distinct phases that define its shape and behavior:
- Initial Decline: The investment value drops due to early-stage costs and fees.
- Stabilization: The curve flattens as operational improvements begin to take effect.
- Growth Phase: The investment starts generating returns, leading to a sharp upward trend.
Industries Where the J-Curve is Common
The J-curve is most commonly observed in industries that require significant upfront investment and time to mature. These include:
- Private Equity: Investments in companies that need restructuring or growth capital.
- Venture Capital: Funding for startups with high growth potential but initial losses.
- Real Estate: Development projects that incur costs before generating rental income or sales.
How to Mitigate the Risks of the J-Curve
Investors can take steps to reduce the impact of the J-curve on their portfolios:
- Diversification: Spread investments across multiple sectors to balance risks.
- Long-Term Perspective: Focus on the potential for high returns over an extended period.
- Active Management: Monitor and adjust strategies to optimize performance during the initial dip.
What is the J-curve effect CFA?
What is the J-Curve Effect in the Context of CFA?
The J-curve effect in the context of the CFA (Chartered Financial Analyst) program refers to a phenomenon observed in portfolio performance or economic metrics, where initial declines are followed by a significant recovery, forming a J shape on a graph. This concept is often applied to explain the short-term negative impact of currency devaluation or policy changes before long-term benefits are realized.
How Does the J-Curve Effect Apply to Currency Devaluation?
When a country devalues its currency, the J-curve effect explains the initial deterioration in the trade balance before improvement occurs. Here’s how it works:
- Immediate Impact: Import costs rise due to the weaker currency, increasing the trade deficit.
- Short-Term Adjustment: Export volumes may not increase immediately, as contracts and prices take time to adjust.
- Long-Term Recovery: Over time, exports become cheaper for foreign buyers, boosting demand and improving the trade balance.
What Role Does the J-Curve Play in Private Equity?
In private equity, the J-curve effect describes the pattern of initial losses followed by gains as investments mature. Key points include:
- Initial Costs: Early-stage investments involve high setup and management fees, leading to negative returns.
- Operational Turnaround: Portfolio companies undergo restructuring or growth strategies, which take time to yield results.
- Profit Realization: As investments mature, returns improve, creating the upward slope of the J-curve.
How is the J-Curve Effect Relevant to Economic Policy?
The J-curve effect is crucial in understanding the impact of economic policies, such as fiscal austerity or trade reforms. Here’s why:
- Short-Term Pain: Policies may initially slow economic growth or increase unemployment.
- Structural Adjustments: Over time, these policies lead to more efficient markets and sustainable growth.
- Policy Evaluation: Policymakers must consider the J-curve when assessing the timing and impact of reforms.
What are the Implications of the J-Curve Effect for Investors?
For investors, understanding the J-curve effect is essential for managing expectations and strategies. Key implications include:
- Patience Required: Investors must be prepared for initial losses before seeing positive returns.
- Risk Management: Diversification and long-term planning can mitigate the impact of the J-curve.
- Performance Metrics: Evaluating investments over a longer horizon provides a clearer picture of success.
Frequently Asked Questions by our Community
What is the Startup Investing J Curve?
The Startup Investing J Curve is a graphical representation of the typical financial performance of a startup investment over time. Initially, the curve dips downward as the startup incurs costs and faces challenges in its early stages. However, as the company grows, achieves milestones, and gains traction, the curve begins to rise sharply, resembling the letter J. This model highlights the initial losses followed by exponential growth in value for successful startups.
Who is credited with popularizing the Startup Investing J Curve?
The concept of the Startup Investing J Curve is widely attributed to venture capitalists and private equity investors who observed this pattern in their portfolios. While no single individual is credited with inventing the term, it has been extensively discussed and analyzed by industry experts like Fred Wilson, a prominent venture capitalist, and others in the startup ecosystem. The J Curve has become a foundational concept in understanding the lifecycle of startup investments.
Why is the J Curve important for startup investors?
The J Curve is crucial for startup investors because it provides a framework for understanding the risks and rewards associated with early-stage investments. It emphasizes the importance of patience and long-term thinking, as the initial dip in value can be discouraging. However, the curve also illustrates the potential for significant returns once the startup overcomes its early challenges and begins to scale. This model helps investors set realistic expectations and manage their portfolios effectively.
Can the J Curve model be applied to all startup investments?
While the J Curve is a useful model, it does not apply universally to all startup investments. Some startups may fail before reaching the upward trajectory, resulting in a complete loss of investment. Others may experience a flatter curve or slower growth due to market conditions, competition, or operational challenges. The J Curve is most relevant for high-growth startups with the potential to scale rapidly, but investors should always consider the unique risks and dynamics of each individual investment.
Leave a Reply
Our Recommended Articles